
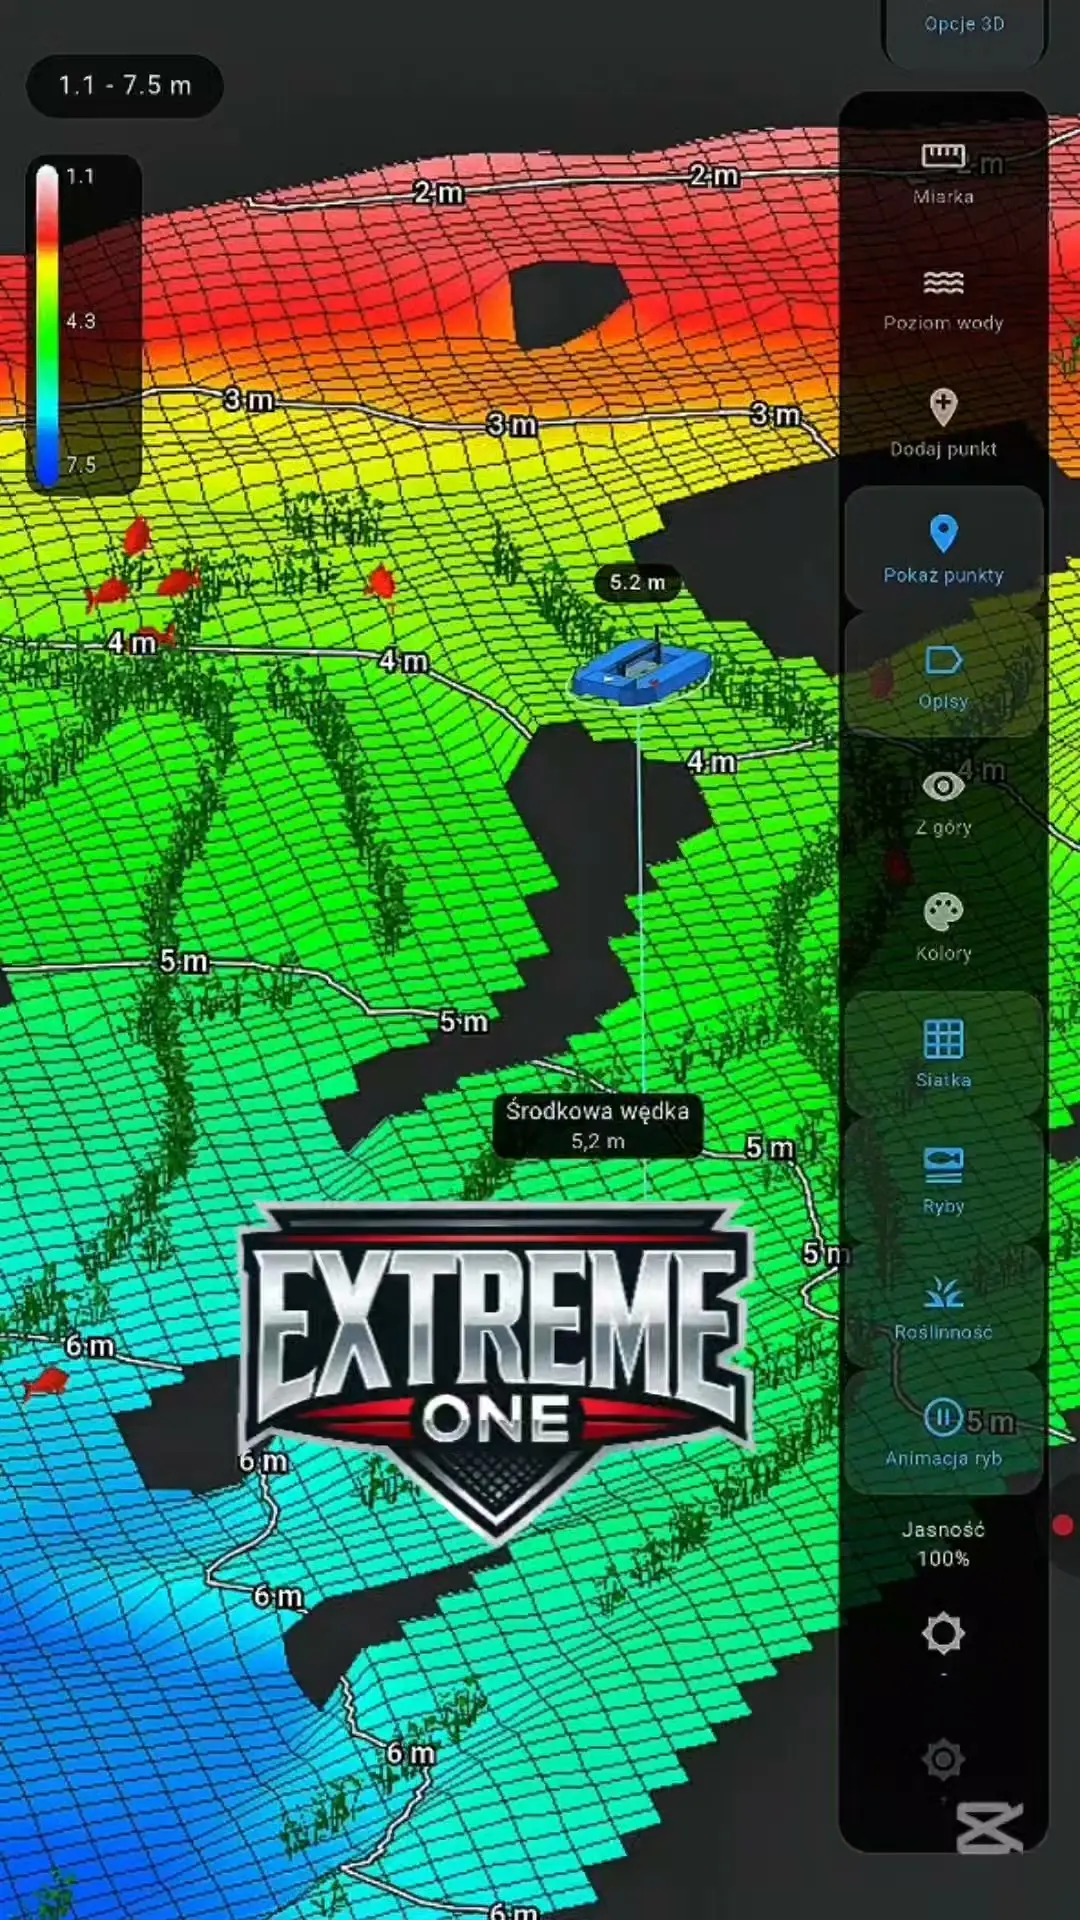
Barcino in 3D: a user’s scan from the Extreme Master Sonar S300
This time we are looking at Barcino in 3D thanks to material from a user. Arkadiusz Krzeminski shared a scan made on a fishery they know well, in order to compare the system’s readings with their own knowledge of the lake.
S300 and analysis of a real fishery
The Extreme Master Sonar S300 collected the readings from which Extreme One produced a bathymetric map and a 3D model. On a model like this you can look at drop-offs, shallow areas and how different parts of the bottom are laid out.
Arek also checked how the bottom structure and vegetation were presented. According to their account, the readings matched places they knew: sandy stretches, vegetation and hard bottom. This is valuable information from practical use of the system on the water.
Why user scans matter
Knowing a fishery yourself lets you compare the fish finder image with what you have already checked while fishing. The saved scan can then be rotated, zoomed and analysed calmly at home. Thank you, Arek, for sharing the material and for your time.
The recording shows a specific scan and its author’s experience. You will find another example of real user data in the Uroczysko Karpiowe presentation.
Barcino in 3D: from a scan to your own observations
What makes this material especially valuable is the experience of the person who recorded it. Arek knows the lake and can compare the image with places they had checked while fishing. That is a different view from simply looking at an impressive model for the first time. Your own observations help identify sections worth analysing and raise specific questions about how the bottom is presented.
Barcino in 3D shows the result of measurements taken during the runs. Before focusing on a single hump or hollow, look at the whole mapped area. Check how the depths are laid out and which parts border each other. Only then move on to the detail. It is then easier to judge whether an interesting spot is a separate point or part of a larger structure in the lake.
Extreme Master Sonar S300 and interpreting the echo
The fish finder provides a signal that the app displays on the sonar recording and uses for analysis. Colours, vegetation indications and the presentation of bottom type help you study the recording. However, it is worth comparing them with the whole reading. Neighbouring columns and successive runs give more context than a single return chosen only because its colour stands out.
In the account attached to the scan, the author compared the readings with sand, vegetation and hard areas of a fishery they know. We keep this information as their experience with this specific material. Presented this way, Barcino in 3D becomes an example of practical verification: the user checks whether what they see in the app matches what they already know about the water.
How to view the model without losing track of scale
First read the depth legend. Then rotate the model to see the chosen slope from several sides. If you are using an altered height scale, keep it in mind when comparing shapes. The numerical labels help you judge the real difference in levels, even when the perspective or display style exaggerates small irregularities on the bottom.
Barcino in 3D is also worth viewing from further away. A plateau, a drop-off and a deeper section do not exist separately: they form a layout to which you relate the position of your rig and your own observations of bites. Looking at the wider surroundings helps you avoid a situation where a zoomed-in detail looks interesting, but you no longer know where it lies relative to the rest of the fishery.
What a user’s recording adds
Material from a real trip shows more than just the final map. It is also an opportunity to talk about how the runs were made, what caught the operator’s attention and which spots were later checked while fishing. Information like this is useful both when developing the app and when learning to read your own sonar recordings. Every lake provides slightly different context.
When presenting your scan, it is worth keeping the original recording and describing the conditions in which it was made. A short note about a familiar section of bottom helps others understand the readings better. If you are comparing several recordings, check their dates and the extent of the measurements. That way you analyse a specific area instead of accidentally comparing different places or runs made at a different water level.
Barcino in 3D and further scan examples
Below we link to the source material and the Uroczysko Karpiowe scan. These are two different examples worth viewing with similar questions in mind: where does the drop-off begin, what are the depth differences and what lies next to the chosen swim. Thank you, Arek, for sharing the recording and allowing us to show your observations to other users of the system.
 Karpik Kroczek, asystent Extreme One