
What the seller forgot to mention #2 – why the Lucky FF918 draws fish it never measured
In part one I showed how a car parking sensor ends up in a housing and gets sold as a depth gauge. Today I put on the bench a device that really is a fish finder and really does measure depth – the most popular wireless sonde on the market, the Lucky FF918. 🎣
I have nothing against the Lucky FF918 for not working. It works. The question is a different one: how much of what you see on that colourful screen is a measurement, and how much is a drawing? To find out, I hooked a logic analyser onto the data line between the radio module and the display and recorded exactly what arrives from the water. Seven independent captures, at different depths.
The result surprised me – and I think it will surprise you too.
1. The entire conversation between the Lucky FF918 sonde and the display is nine bytes
The Lucky FF918 float transmits on 433 MHz at roughly 333 bits per second. That is very slow – for comparison, the oldest dial-up modem from the 1980s was faster. One data burst is exactly 9 bytes, less than a single short word in a text message. A new burst arrives every 0.77 seconds.
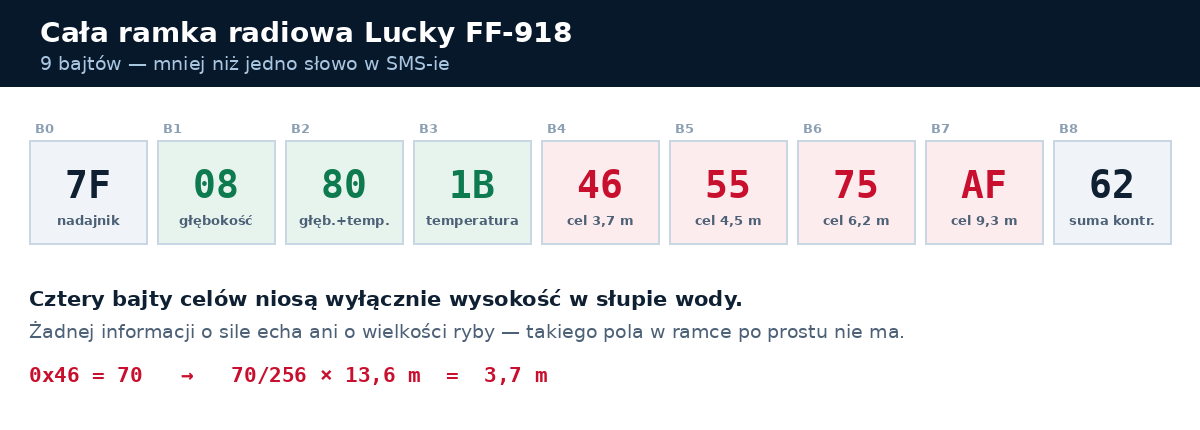
And that is the whole of it. Nothing else passes between the float and the display:
- transmitter number – so the display knows this is its own sonde, not the one belonging to the angler in the next swim
- depth – a real measurement
- water temperature – a real measurement
- four target fields – one byte each
- checksum – a check that nothing got corrupted on the way
2. Those four bytes carry height only – nothing else
Each target byte is a number from 0 to 255, stretched between the surface and the bottom. Zero means “nothing here”, 255 means “right on the bottom”, 128 means “halfway down”. That is all.
What hardware I test and on what legal basis
Every device described in this series was bought with my own money and is my property. I examine these units to know what actually reaches an angler’s hands and what I can demand from the hardware I design myself. The analysis covers one specific unit and the firmware version I found in it; other batches, versions and model variants may behave differently.
Observing, studying and testing how a program works in order to determine its underlying principles is permitted for a person who lawfully acquired the device: Article 75(2)(2) of the Polish Copyright Act, which implements Article 5(3) of Directive 2009/24/EC. The transmission capture involved only my own transmitter and my own receiver. I publish no source code, no memory dumps, no keys and no tools that would let anyone copy someone else’s software – only conclusions about what the hardware measures and what it does not.
Names and trademarks belong to their respective owners and are used solely to identify the hardware under review, as part of critical analysis and the right to inform. Photos taken from sales listings are used for the same purpose. If the manufacturer or the seller believes any conclusion is wrong, I will gladly repeat the measurements on a unit they provide and publish a correction.
Worth noting, because it matters when you read the screen: a target byte is a fraction of the depth, not a distance. The same byte means 1 metre when the bottom is at 2 metres, and 10 metres when the bottom is at 20. The scale always stretches from the surface to the bottom.
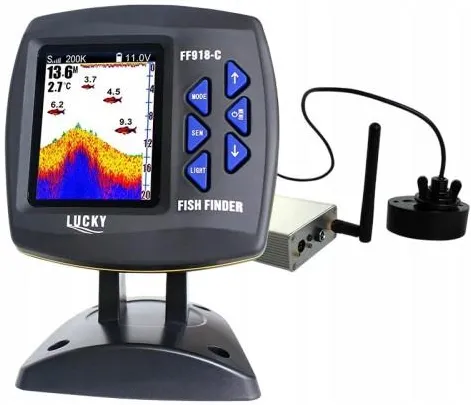
Let us check that against the manufacturer’s own Lucky FF918 promo photo. It shows a depth of 13.6 m and a fish labelled 3.7 m. The byte carrying it has the value 70. The arithmetic: 70 divided by 256, times 13.6 metres, gives 3.72 metres. That matches the number printed above the fish down to the decimetre.
What that byte does not contain is a single bit of information about echo strength. Nor about target size. Nor about how hard something bounced the sound back. The sonde only ever answers the question “at what height”, never “what” and “how big”.
3. The Lucky FF918 has no idea whether it is a fish, a weed bed or a fallen tree below you
This follows directly from point two, but it deserves to be said separately, because it translates straight into your fishing. The Lucky FF918 float reports a target in the water column – that is, the fact that somewhere between the bottom and the surface something reflected the signal. And that is where its knowledge ends.
There is no field anywhere in that transmission saying “this is a fish” or “this is a weed”. No classification. No recognition. And yet the display draws a fish every single time – because it simply has no other icon.
In practice that means anything at all becomes a fish on the screen: a clump of weed growing off the bottom, a fallen tree, a jutting branch, a stump or any other snag, air bubbles, a thermocline, suspended matter after rain, even the echo from your own line or rig. The device is not lying – it simply has nothing to tell one from the other with.
There is one more trap, far less obvious. Tall weed, a fallen tree or a jutting branch return echoes from several heights at once – from the bottom right up to their tip. The sonde then reports several targets one above the other, and the display turns them into several separate fish stacked in a column. That characteristic “stack of fish” above the bottom, which looks like a feeding shoal, is very often just one bush or a sunken branch.
So three “fish” standing motionless in the same spot for a quarter of an hour are almost certainly weed, a snag or sunken structure, not a group of carp waiting for your rig. And it works both ways: you will not learn about the snag either, because the device shows it to you as a fish instead of warning you not to drop your rig there.
4. Fish size on the Lucky FF918 screen is drawn at random
Here we get to the thing that genuinely stopped me at the bench, and that says the most about the Lucky FF918. If there is no field in the transmission describing target size – where does the display get small, medium and large fish from?
It rolls dice for them. On every received data burst, for every target, a random number generator is fired up and assigns a size class:
| Random roll | Chance | What you see on screen |
|---|---|---|
| 1 | 18.75% | big fish – the largest icon, plus an audible alarm |
| 2 | 50.00% | medium fish |
| 3 | 31.25% | small fish |
Everything that separates a “big fish” from a “small” one follows from that single roll: which ready-made bitmap gets pasted onto the screen, how large the coloured marker is, and whether the unit beeps an alarm.
And to be clear about where that certainty comes from – the point is not that the algorithm is poor. The point is that there is no field in the radio frame that could carry target size at all. Even if the display badly wanted to show it honestly, it would have nothing to show it from.
How to check it yourself, with no equipment at all
You do not have to take my word for it and you do not need to read code:
- Lower a can, a stone or a branch on a string – roughly halfway down.
- Watch the height of the icon – it will be stable, because the position is worked out honestly.
- Now watch its size – that same motionless can will be a “small fish” one moment and a “big” one the next, changing every second.
That single test shows both things at once: the steady height proves the position measurement is real, and the flickering size proves the size is invented. Film it on your phone, it is plain as day.
5. The colourful Lucky FF918 echogram is mostly not a measurement
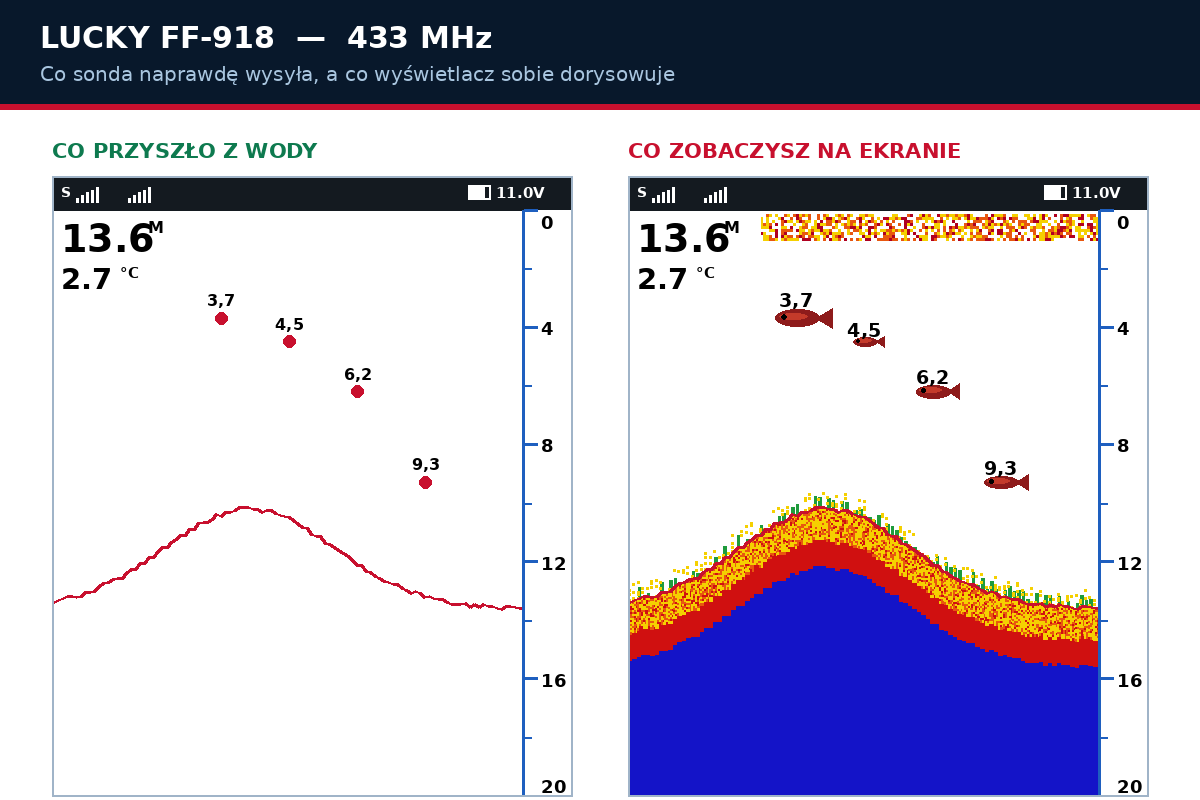
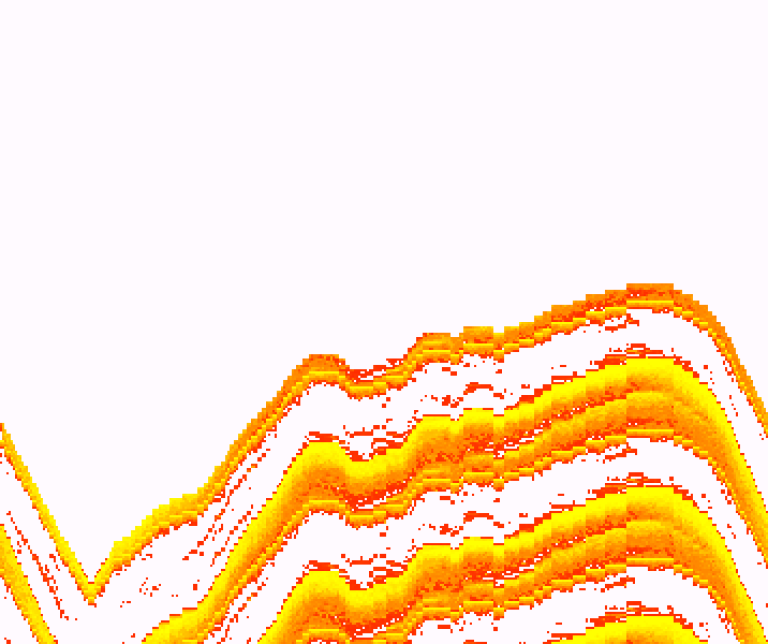
Go back for a moment to the Lucky FF918 graphic at the top of this article. On the left is everything that arrived from the water: a red bottom line and four points. On the right, the same data set after processing in the display.
Note that the red bottom line is pixel-for-pixel identical on both images. Because the bottom contour is real – one honest measurement per data burst. The height the echo came back from is real too – although the sonde says nothing about what reflected it.
Everything else, however, is created on the spot, inside the display, from ready-made patterns stored in its memory:
| Image element | Where it comes from |
|---|---|
| Bottom line, depth as a number | measurement |
| Temperature | measurement |
| The height the echo came back from | measurement |
| Size and type of the fish icon | random roll in the display |
| Yellow and red bottom texture | pattern from device memory |
| Green weed along the bottom | shape generator, independent of the water |
| Noise band near the surface | always drawn, at a random thickness |
| Smooth scrolling of the image | filler between data bursts |
The water column on that screen is 445 pixels tall. It is drawn from four numbers.
6. Why does the Lucky FF918 work this way? Because a real image does not fit through 433 MHz
And here I want to be fair to the manufacturer: this is not malice, and it is not penny-pinching. It is physics and regulation.
Let us work out what a decent fish finder needs in order to draw a real picture of the bottom. Take a modest 300 samples per ping:
| Component | How many bits |
|---|---|
| Image: 300 samples of 8 bits | 2,400 |
| Telemetry: depth, temperature, voltage, status, checksum | + 80 |
| Total per ping | 2,480 |
| Ping every 100 ms, i.e. 10 times per second | 24,800 bits per second |
| Radio protocol overhead, about 30% | 32,000 |
| Band occupancy only 65%, to leave headroom for repeating lost frames | about 50,000 bits per second |
The Lucky FF918 pushes through about 94 bits per second. That is roughly 500 times too little. A real bottom image cannot be squeezed through 433 MHz – so the image has to be created in the display. And it is.
Why does the headroom for retries matter? Because at long range frames get lost. If the link is filled to the brim, a lost burst cannot be repeated and the image tears. And why ping more often than every 100 ms? Because each ping is one column of the image – at 10 pings per second every column is a real measurement. With fewer pings, a gap opens up between them that the device has to fill with something.
What this means when you buy a bait boat with a fish finder
This is the conclusion worth taking with you when you go shopping. If somebody offers you a bait boat that, over one narrow radio link, is meant to steer the boat – motors, rudder, lights, hoppers, spreader – and deliver a fish finder image at the same time, then those two things are fighting over the same very narrow pipe.
Control has to flow continuously and without delay, because whether the boat turns depends on it. The image needs bandwidth. On the 868 MHz band there is a legal limit on top of that – you may only transmit for a fraction of the time, so even a fast modem averages a few hundred bits per second.
| Band | Real throughput | Will it carry a real echogram? |
|---|---|---|
| 433 MHz (this is what sits in the FF918) | about 94 bps | No – 500 times too little |
| 868 MHz | from a few dozen bits up to 1 kbps | No – duty cycle limit |
| 2.4 GHz LoRa | a few dozen kbps | Yes, with sensible headroom |
| 2.4 GHz WiFi | 20-35 Mbps | Yes, with huge headroom |
So it is worth asking the seller a simple question: on what frequency and at what data rate does your sonar image travel? The answer will tell you more than the entire product description.
Summary – what the Lucky FF918 never tells you outright
To sum up honestly, because this is not a dummy device and I have no intention of pretending it is:
- Depth and temperature are real – as a tool for checking a spot before you cast, the device does its job.
- Echo height is reproduced faithfully, but that does not mean there is a fish there. If the sonde reported a target at 4 metres, the icon will sit at 4 metres – except a bush may be growing underneath it rather than a carp swimming.
- Do not treat icon size as information – it is random, a big icon does not mean a big fish.
- A fish icon does not mean “fish” – the sonde only reports a target in the water column, and weed, a fallen tree, a snag or bubbles all look identical on screen.
- The colourful echogram is not a picture of the bottom – the texture, the weed and the colours are graphics from the device memory.
- Four targets at once is the ceiling – a shoal has no way of showing itself.
In other words: the Lucky FF918 is a decent depth gauge with a thermometer plus a “something is hanging in the water column” indicator. It is not a fish finder in the sense an angler means when looking at a picture of the bottom.
How I tested the Lucky FF918 fish finder
A logic analyser tapped onto the Lucky FF918 data line, between the radio module and the display, seven independent captures at different depths and temperatures. The data travels in the clear there, with no encryption at all. All seven captures resolve into the same 9-byte bursts – and the temperature read out of them stands rock steady in every capture while the depth changes smoothly. That is what a correctly decoded protocol looks like. On top of that I traced the logic of the display itself, to establish what it does with that data.
What I did not test, so I do not write about it: I make no claims about the quality of the transducer itself or about how well the sonde detects targets in the water – I have no data for that. Nor do I claim the device measures depth badly. I describe only what I proved: what the sonde sends and what the display does with it. The analysis covers one particular unit and the firmware version I found in it.
The comparison graphic at the top of the article is my reconstruction, drawn with the very algorithm I found in the display – not a screenshot from the device.
Sources and material to check for yourself
- Commission Decision 2006/771/EC – spectrum harmonisation for short range devices in the EU, the source of the limits for the 433 and 868 MHz bands
- ETSI EN 300 220-2 – the harmonised standard setting out powers and permitted transmission time
- Office of Electronic Communications – the Polish regulator, list of devices exempt from a radio licence
- Semtech SX1280 – a 2.4 GHz LoRa chip, an example of a band with enough throughput for a sonar image
Disclaimer. The analysis covers one particular unit and the firmware version I found in it – other batches and model variants (FF918-C, CWLS and derivatives) may differ. Radio and throughput limits are given as ballpark figures, in line with EU rules for short range devices; exact values depend on the sub-band and the specific implementation. If yours behaves differently – drop me a line, I will happily check another unit.
That is how we work: before anything goes into our boats, it goes across this bench. And if it does not pass – we say so out loud, even when nobody wants to hear it.
 Asystent pomocy Extreme One