
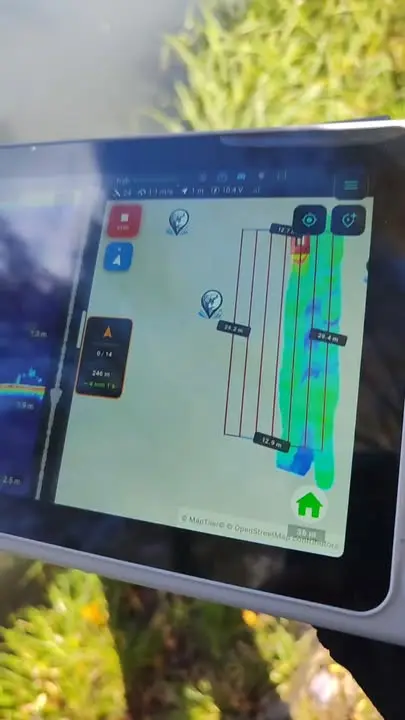
Live 2D and 3D bathymetry: Extreme One in a Hybrid Boat & Service video
Live bathymetry shows what it can do best when you are working on the water. The authorised service centre Hybrid Boat & Service has shared a video presenting Extreme One and the 2D and 3D bottom maps created from fish finder measurements.
From the boat’s run to a bottom map
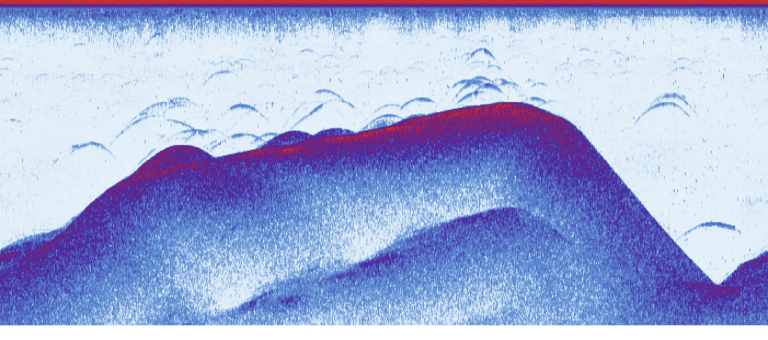
The sonar recording shows successive sonar readings, and the position assigned to them allows the measurements to be placed on the map. The 2D view makes it easier to see how depths are distributed. The 3D model helps you look at drop-offs and level differences from another perspective.
This video comes from the service centre and shows real use of the system. We thank the Hybrid Boat & Service team for the presentation and for sharing the results of their work on the water. You can watch the video on Facebook using the link below the article.
See also a scan made by a user
We show a similar way of analysing data using Uroczysko Karpiowe as an example. In a separate post you will find a bottom model from a scan made during a competition and a comparison of small depth differences.
Live bathymetry: what you see in the service centre’s video
The most important thing in the recording is the link between a measurement and a specific place on the water. The boat covers successive sections, the fish finder collects readings, and the app uses the saved positions to show the depth. It is worth watching this process from the beginning. The finished colour map is the result of the runs, so interpreting it starts with recognising which part of the lake was actually measured.
Live bathymetry helps you watch information about the swim build up. Instead of remembering a single number from the display, you see the depth layout in neighbouring places. This is useful when looking for the edge of a plateau or the direction of a drop-off. Every further run adds context that may be missing when you judge a single reading without reference to the map.
How to compare the 2D view and the 3D model
Start with the map viewed from above. It is then easier to see where the surveyed area lies in relation to the bank and the marked points. Check the legend, read the depth range and find the place where the values start to change. You do not have to zoom in all the way straight away. It is better to first see how the interesting section connects with a larger part of the fishery.
The 3D model then makes it easier to look at this layout from another side. Rotating lets you look along a drop-off or across it. When you assess a small hump, compare the look of the surface with the labelled depths. Live bathymetry and later analysis of the recording share the same basis: measurements that should be read together with the position, scale and range shown in the app.
The Hybrid Boat & Service video from real use
The service centre’s presentation is valuable because it shows the system in the environment where anglers use it. Light may fall on the screen, the boat is moving, and the operator carries out successive tasks. A recording like this shows not only the final model but also how the app is used while collecting data on the water.
The Hybrid Boat & Service video is available at the link below, so you can see the context of the presentation and the author’s commentary. The illustration screenshot comes from that video. We do not replace it with an image from another fishery, because in a practical presentation it matters that the reader knows which run the readings refer to.
What to remember before your own mapping
Live bathymetry is most useful when the measurements cover the area of interest in a way that lets you compare neighbouring sections. Pay attention to where the runs are and how clearly the depth readings come through. When you finish, keep the recording. That way you can later return to the sonar recording, look at the model more calmly and compare it with your fishing experience.
When you show your scan to someone else, start by explaining where you took the measurements and what the legend shows. Only then point to a specific drop-off or hole. Live bathymetry then becomes clear material for a conversation about the fishery. The Uroczysko Karpiowe example linked below shows exactly this move from the general picture to small differences in bottom level.
Live bathymetry and notes from your trip
When you have finished measuring, choose a few places you want to return to. Look at their surroundings and write short notes about the drop-off or shallow area you noticed. On your next trip it will be easier to compare your expectations with new readings. The video prepared by the service centre shows the starting point for this kind of work: a real run, the fish finder reading and a map you can continue to analyse at your own pace, including after you get home.
 Karpik Kroczek, asystent Extreme One