
What the seller forgot to mention #3 – why the XJ02B fish finder sends a real image nobody can read
This is part three of the series in which I check how much of what you see on a fish finder screen is a measurement and how much is a drawing. In the previous episode the Lucky FF918 turned out to be a depth gauge with a thermometer that draws its colourful echogram from memory and rolls dice for fish size.
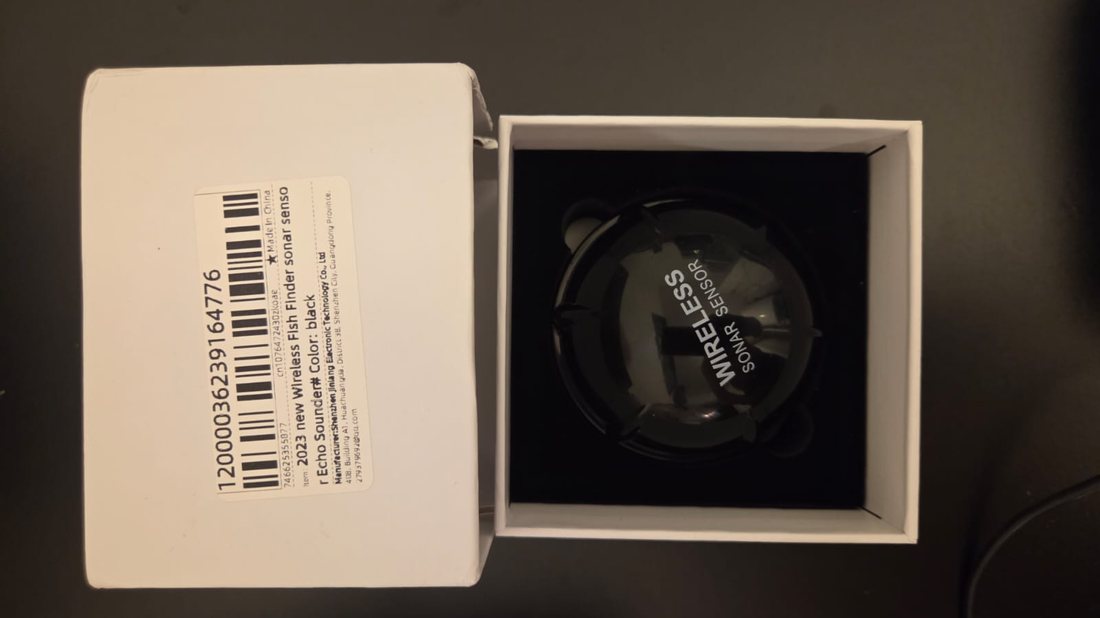
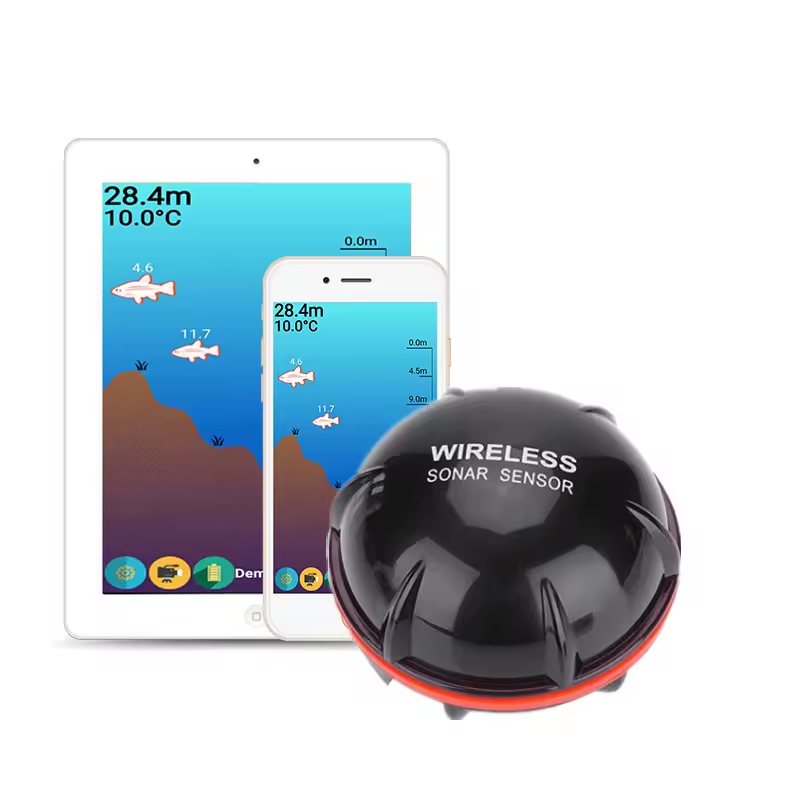
On the bench today is something far cheaper and nameless: a black ball for the equivalent of about fifty euros from a Chinese marketplace, sold as a “2023 new Wireless Fish Finder”. On the underside a sticker saying SONAR 125 kHz and that is it. Bluetooth, the Fish Helper app, not even a manufacturer name on the housing.
And here comes the surprise, because the XJ02B sends a real cross-section of the echo, not four numbers like the FF918. That sounds like a whole class up. But I worked out how much of that cross-section falls on a fish, and it turns out to be too little to judge anything reliably.
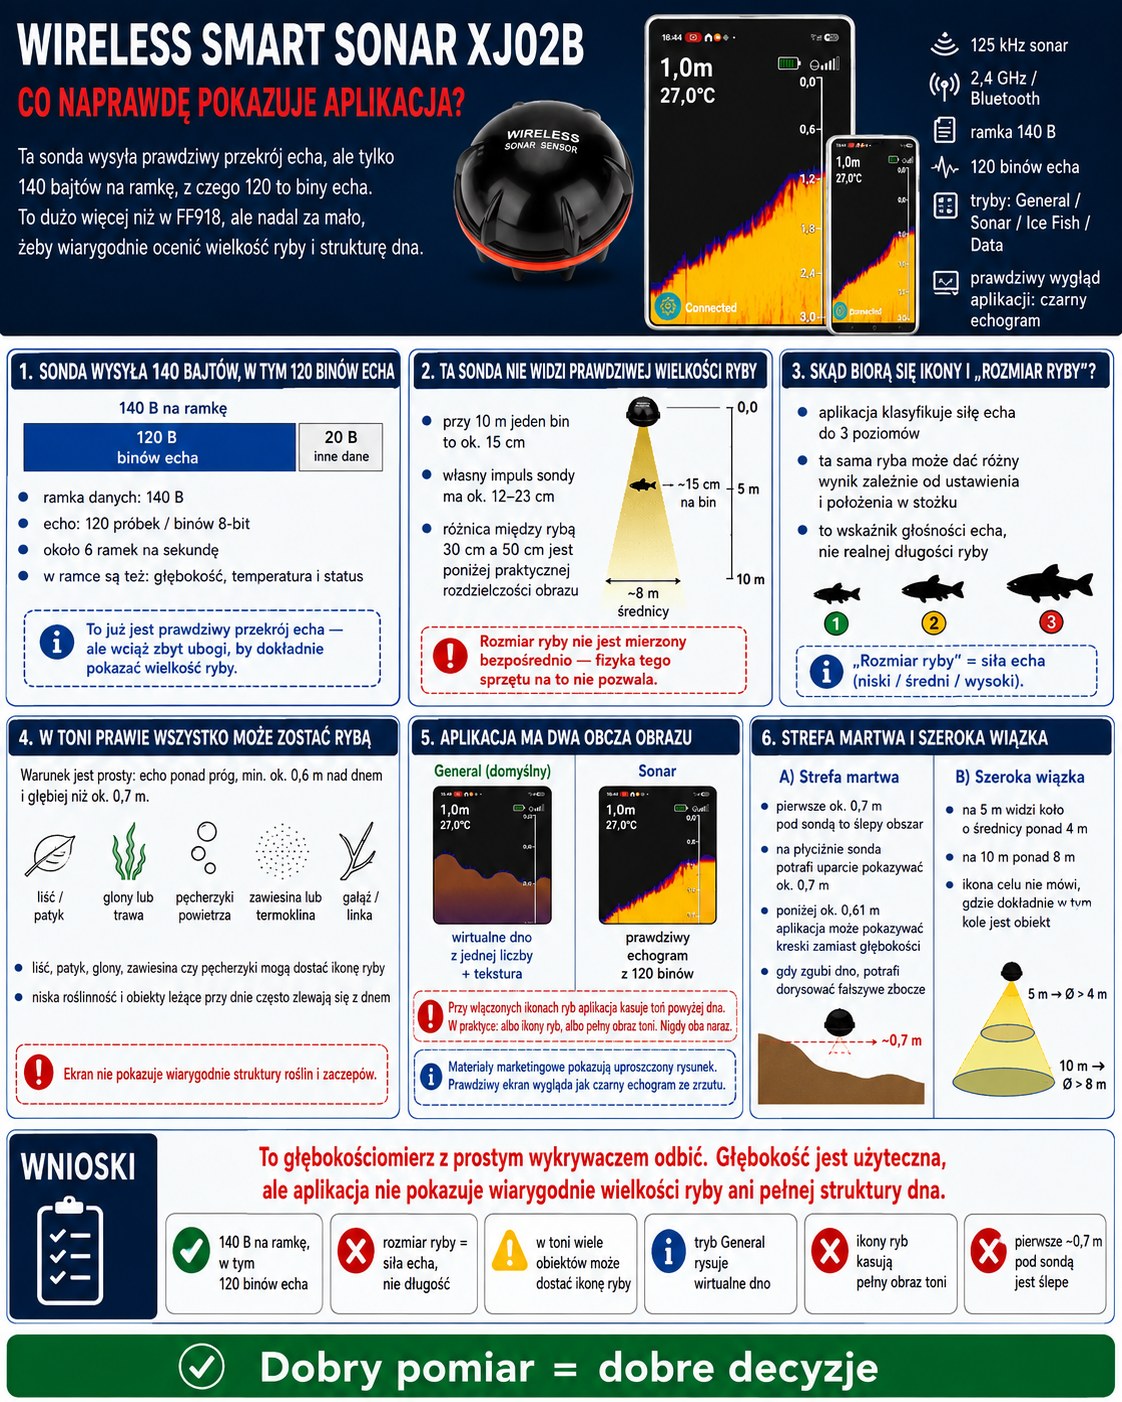
The entire conversation between the XJ02B and the phone is 140 bytes, 120 of which are echo samples
I connected a phone to log the Bluetooth traffic and took what arrives from the water apart, byte by byte. The frame has a fixed length of 140 bytes and arrives about six times per second.
- 120 bytes are consecutive echo loudness samples, from the surface down to the set depth
- 2 bytes are the depth
- 2 bytes are the temperature
- 3 bytes are the sonde’s finished verdict: target depth and its “size” on a scale of 1 to 3
- the rest are start and end markers, battery level, settings and a checksum
For comparison: the Lucky FF918 sent nine bytes and four numbers saying only “something is hanging at this height”. Here we get a real cross-section. A hundred and twenty sounds like a lot. You are about to see why it is still too little.
The XJ02B lights up a layer 16 centimetres thick at a time, and that sets everything else
This is the part no product description explains, and without it the rest makes no sense.
The XJ02B does not look at the whole water column at once. It sends one short sound pulse, which has a certain length in the water, and listens to what comes back. At any moment it hears the reflection from only that one layer which happens to be passing through. The layer travels downwards at the speed of sound, about one and a half kilometres per second, and on the way the sonde records 120 consecutive loudness samples.
At 125 kHz one cycle lasts 8 microseconds. The transducer needs a few dozen cycles to swing up, so in practice the pulse occupies between 12 and 23 centimetres of travel in the water, depending on the depth range in use. At 10 metres of water that is about 16 centimetres.
And from that comes the most important limitation of this hardware: whatever is thinner than that layer has no shape. It will not draw an arch, it will not make a blob of any particular size. All it will do is make one of the 120 samples louder than its neighbours.
The XJ02B cannot see how big a fish is: the difference between thirty and fifty centimetres is a quarter of one sample
Let us work it out directly. At 10 metres of water the XJ02B switches to the 18 metre range, so one image sample covers 15 centimetres of the water column, while the pulse is 16 centimetres long.
| Water depth | One image sample | 30 cm fish | 50 cm fish | Difference |
|---|---|---|---|---|
| 3 m | 2.5 cm | 7.1 samples | 8.7 samples | 1.6 samples |
| 5 m | 5.1 cm | 3.8 samples | 4.6 samples | 0.8 samples |
| 10 m | 15.2 cm | 1.5 samples | 1.7 samples | 0.26 samples |
| 20 m | 22.9 cm | 1.3 samples | 1.4 samples | 0.17 samples |
A quarter of a sample is less than one pixel of the image. At 20 metres the difference drops to one sixth. Even in the best case, at 3 metres, it is one and a half samples.
The conclusion is uncomfortable but unambiguous: the XJ02B is physically incapable of seeing how big a fish is. And not because there are too few samples. Because its own pulse is thicker than the fish. That is the physics ceiling of this hardware, and no firmware update will move it.
Fish size on the XJ02B is echo loudness, not fish length
Since size cannot be measured, the XJ02B has to get it from somewhere. It takes it from echo loudness and drops it into three bins: quiet is a one, louder is a two, loudest is a three. That single byte goes to the app, which draws the matching icon.
The trouble is that echo loudness depends above all on two things that have nothing to do with the length of the fish:
- how the fish is oriented at the moment of measurement, side-on or nose-on to the sonde
- how far from the centre of the beam it swims, because at the edge of the cone the echo is markedly weaker
Credit where it is due: unlike the Lucky FF918, size is not random here. It is calculated. Only it is calculated from a quantity that says very little about the length of a fish. The same fish, on the axis of the cone and at its edge, will be given two different sizes.
The bottom on the XJ02B is simply the loudest of the 120 samples
Since the XJ02B has 120 numbers, it has to decide somehow which one is the bottom. I checked that in its firmware: it walks down through them and remembers the loudest sample. That one it declares to be the bottom.
It does not check whether the echo is flat. It does not check whether it is hard. It does not compare it with the previous ping. Simply the loudest one.
The consequence: if a tight shoal is sitting under the boat, or something hard is hanging above the bottom and reflects more strongly than the bottom itself, that will be taken for the bottom. And you will not even notice, because the app draws the bottom line through an averaging filter over the last sixteen readings. Instead of a step it will draw a gentle slope. The bottom will rise and come back, as if you had passed over a hump that is not there.
In the water column almost anything can become a fish for the XJ02B
I checked what the XJ02B uses to recognise a fish. There are three conditions and that is the entire list:
- the echo is louder than a threshold that depends on the sensitivity setting
- the target is at least 0.6 metres above the bottom
- the target is deeper than 0.7 metres below the sonde
There is no analysis of echo shape. There is no check of how long the echo lasts. There is no tracking of a target between consecutive pings. The decision is made on one sample from one ping.
| What is really under the boat | What the XJ02B will show |
|---|---|
| a fish | fish icon |
| a floating leaf, a stick, a mat of algae | fish icon |
| bubbles, suspended matter after rain, a thermocline | fish icon |
| a suspended branch, a snapped line | fish icon |
| weed taller than 0.6 m off the bottom | fish icon, and only the tips at that |
| weed shorter than 0.6 m off the bottom | nothing, it is invisible |
| a log lying on the bottom | nothing, it merges with the bottom |
So it works both ways and both are bad. What you really want to know before you drop a rig, namely where the weed is and where the snag lies, has no representation whatsoever on that screen.
The Fish Helper app has two bottom images, and the default one never touches the measurements
The publicly available app has two independent ways of drawing the bottom, and these are not two graphic styles but two different ways for the image to come into being.
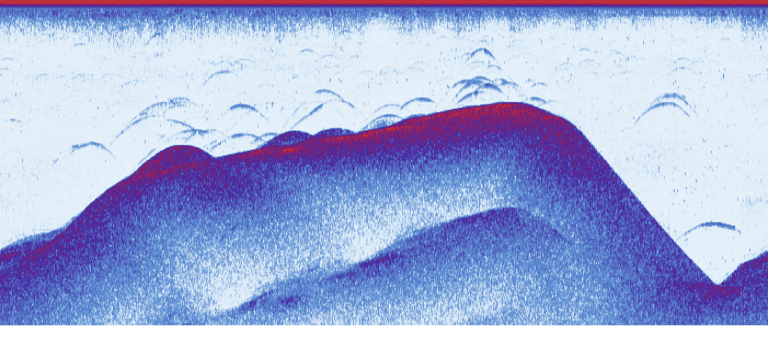
- Sonar mode takes those 120 measurements and turns them into a real echogram.
- General mode is called, literally in the code, “virtual bottom image calculation”. It does not touch the measurements even once. It takes a single number, the depth, smooths it and fills everything below the line with a ready-made bitmap from a file that scrolls round and round.
General mode is the default. After installation the app starts in exactly that mode.
Switch over to Sonar and you walk into the next trap. With the fish icons on – and they are on by default – the app finds the bottom before drawing the image and zeroes out everything above it. The whole water column, every weak echo, all the weed. What remains is the bottom trace and the icons floating above it.
So you have a choice nobody tells you about: either the fish icons or the picture of the water column. Never both at once.
The first 0.7 metres under the XJ02B is blind, and below 0.61 m the app shows dashes
The transducer behaves like a bell. While it transmits, and for a long while after it stops, it is deaf, because its own sound drowns out everything coming back. Measurements on the water give a dead zone of about 70 centimetres.
A fish sitting 60 cm under the sonde does not exist. Neither does bait right under the boat. In shallow water this becomes a serious problem, because the bottom itself falls into that dead zone.
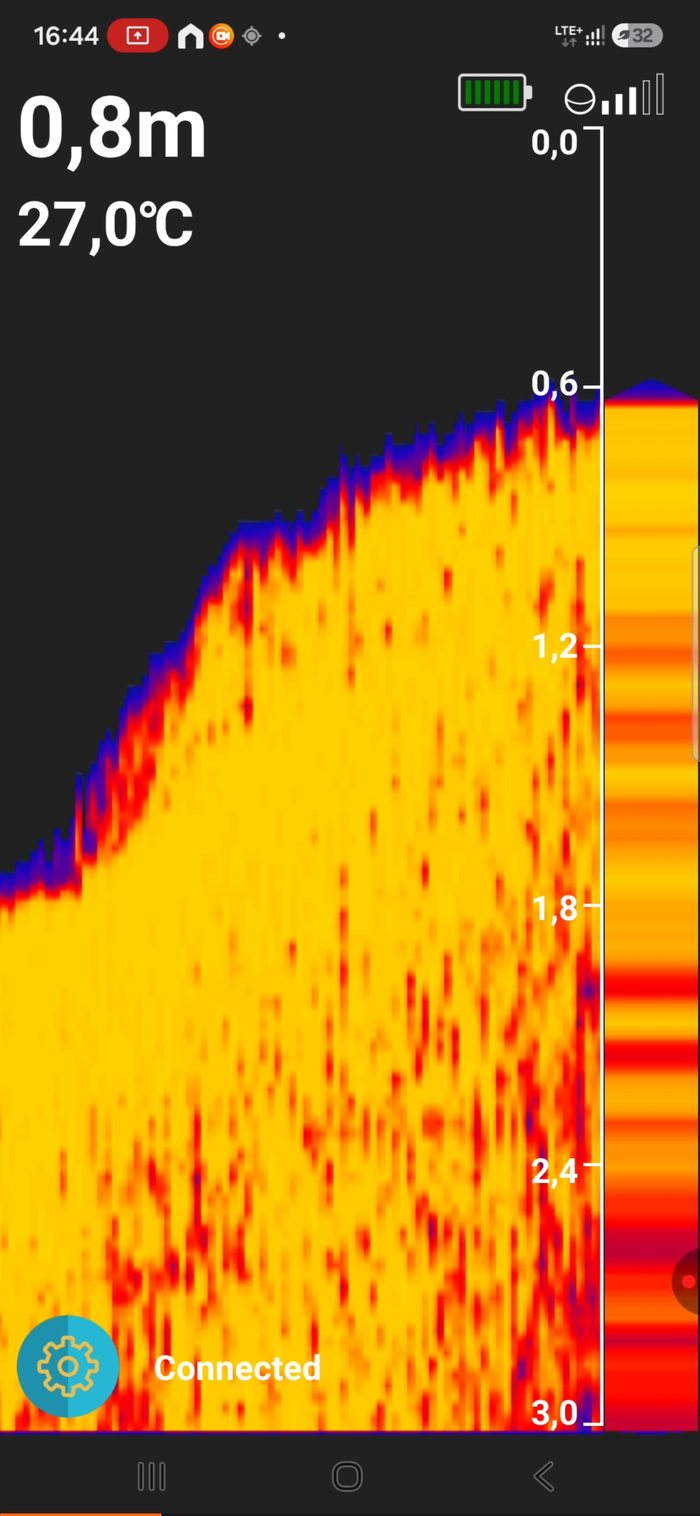
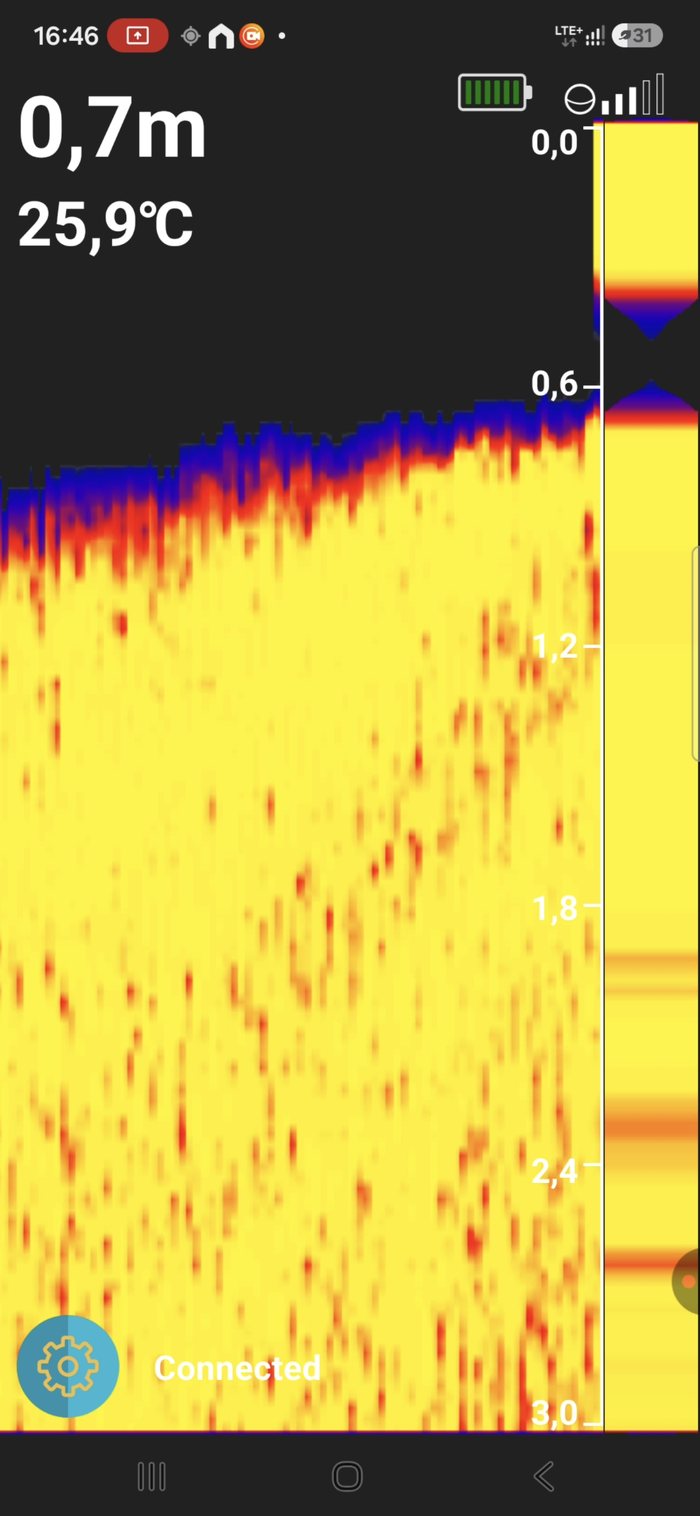
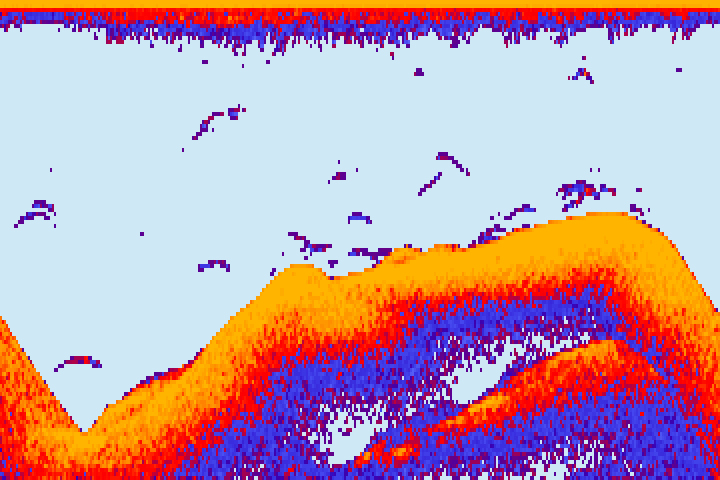
That yellow layer is not separate information about the bottom. It is the top of the scale: a deafened receiver writes in the largest possible value, and the palette paints the maximum yellow. The real bottom is lost somewhere inside that blob.
Below a certain limit the app simply refuses to cooperate. There is a hard condition in the code: if the depth is less than 0.61 metres, show dashes instead of a number. Not “measure more carefully”, not “warn the user”. Dashes.
There is one more behaviour visible only in the shallows. When the XJ02B loses the bottom, the app substitutes 76 metres in its place and runs the line down to it through that same averaging filter. Instead of a step it draws a gentle slope. That is where the hill that suddenly grows in shallow water comes from. Nobody measured it.
At 10 metres the XJ02B lights up a circle 8 metres across
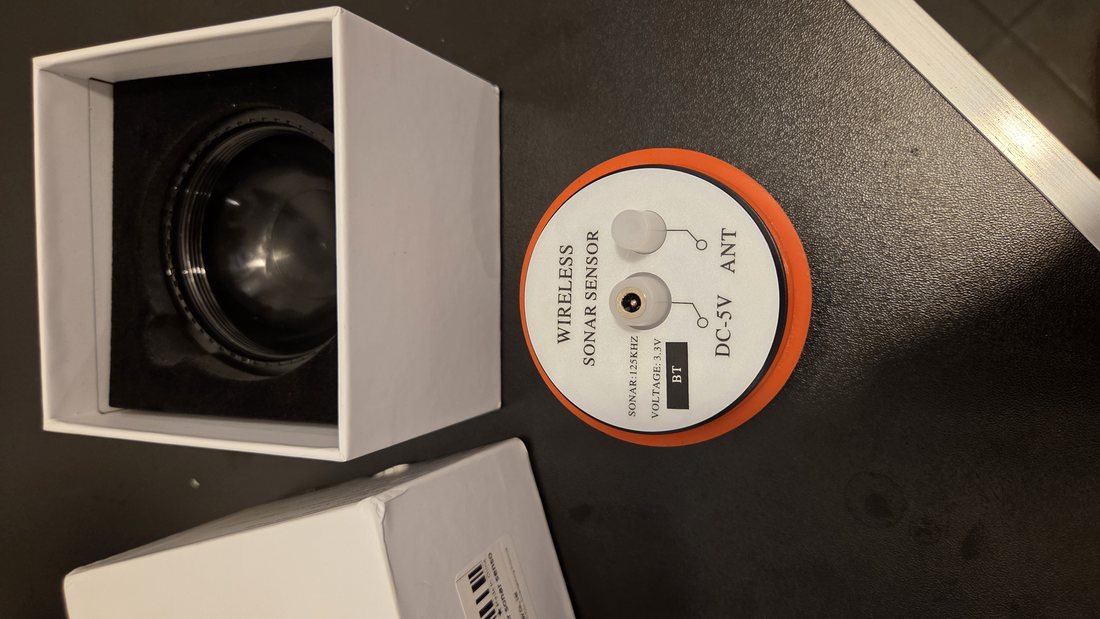
The XJ02B does not shine straight down like a laser, but like a torch: the deeper it goes, the wider the circle it lights up. Sellers quote 90 degrees for this class of hardware, which I do not believe, because it does not square with physics. At 125 kHz the wave in water is about 12 millimetres, and to get a 90 degree cone the element would have to be some 8 millimetres, i.e. smaller than the wave it transmits. Realistically it comes out at about 45 degrees, which is confirmed by another sonde from the same family that declares exactly that at the same frequency.
| Water depth | Diameter of the lit circle (45°) |
|---|---|
| 5 m | over 4 metres |
| 10 m | over 8 metres |
| 20 m | over 16 metres |
At 10 metres of water the target you see may be directly beneath you or four metres off to the side. You have no way of telling. And remember, it does not have to be a fish at all.
The XJ02B never measures what is directly under the boat
This follows directly from the previous section, but it is important enough to deserve its own place. Since the sonde lights up a circle eight metres across, it hears reflections from that entire circle at once. And because it declares the loudest sample that arrived earliest to be the bottom, in practice it reports the depth of the nearest strong reflection from the whole circle, not of the point you happen to be sitting over.
On a flat bottom that makes no difference, because the nearest point happens to be under the boat. The problem starts everywhere the bottom is not flat, which is exactly where you are looking.
On a slope the sonde shows the perpendicular distance, not the depth
When you pass over a drop-off, the shallower edge of the slope falls inside the cone and its echo comes back earlier than the echo from under the boat. So the XJ02B reports the distance to the nearest point of the slope, in practice the distance perpendicular to the bottom surface. Always in one direction: too shallow.
| Bottom slope | Real depth under the boat | What the XJ02B will show | Error |
|---|---|---|---|
| 5° | 10.00 m | 9.96 m | 4 cm |
| 10° | 10.00 m | 9.85 m | 15 cm |
| 15° | 10.00 m | 9.66 m | 34 cm |
| 20° | 10.00 m | 9.40 m | 60 cm |
| 25° | 10.00 m | 9.06 m | 94 cm |
| 30° | 10.00 m | 8.66 m | 1.34 m |
On a 20 degree slope, a typical gravel pit shelf, the XJ02B will lie by sixty centimetres. On a steep edge, by more than a metre. And it will not signal it in any way, because from its point of view everything is fine: it found a strong echo and reported it.
Weed or an obstacle inside the cone takes over the depth reading
The same mechanism works with obstacles and is even more misleading. If a clump of weed stands anywhere in the lit circle, a branch lies there or a rock juts out, and it reflects more strongly than the soft bottom under the boat, the XJ02B will report the depth of that obstacle and take it for the bottom.
| Water depth | Diameter of the lit circle | Object 1 m above the bottom inside that circle |
|---|---|---|
| 5 m | 4.1 m | the sonde may report 4 m instead of 5 m |
| 10 m | 8.3 m | the sonde may report 9 m instead of 10 m |
| 20 m | 16.6 m | the sonde may report 19 m instead of 20 m |
In practice that means that when you map a water with a sonde like this, you are not measuring the bottom but the envelope of everything that reflects within a radius of several metres. A spot marked as 9 metres may be the nine-metre top of a clump of weed standing four metres off your run, while under the boat itself there are ten metres of clean bottom.
And that is the difference between a wide and a narrow cone that sellers do not mention. A narrow cone is not a worse specification, it is a better one. The narrower the circle, the greater the chance that what you see really is beneath you.
How to check it yourself, with no equipment at all
You do not have to take my word for it. Three tests, each of them a few minutes’ work:
- Switch from General to Sonar. In General the bottom is smooth and always has the same texture. In Sonar it turns grainy and weak echoes appear. Same water, same second, and the only difference is whether the app used the measurements.
- Turn the fish icons off and look at how much suddenly appears in the water column. All of it was there the whole time, it was just erased to make room for the icons.
- Go into shallows below 0.7 metres. You will see a stubborn 0.7 m regardless of the real depth, a yellow layer flooding the screen, then dashes instead of a number, and finally a hill growing out of nowhere.
Summary – what the XJ02B never tells you outright
- It will not tell a 30 cm fish from a 50 cm one, because its own pulse is longer than the fish. At 10 metres the difference amounts to a quarter of one image sample.
- “Fish size” is echo loudness, driven mainly by the orientation of the fish and its position in the cone, not by its length.
- Any reflection in the water column can become a fish. Weed along the bottom and snags have no representation on the screen at all.
- The bottom is the loudest sample, with nothing checked. A shoal above the bottom can replace it, and the filter will turn that into a gentle rise.
- It does not measure what is under the boat, but the nearest strong reflection from a circle eight metres across. On a 20 degree slope it is out by 60 cm, always too shallow.
- The first 0.7 metres is blind, and below 0.61 metres the app shows dashes instead of a depth.
- The default mode draws the bottom from a bitmap, and the fish icons, when on, erase the entire water column.
In other words: this is a depth gauge with a simple reflection detector. It measures depth properly and that is genuinely useful. It detects that something is in the water column, and that has value too. But that is where it ends.
Against the Lucky FF918 this is still a step up, because there the bottom image was a drawing from end to end and fish size was literally rolled at random. Here a measurement exists and it is real. If, however, you are buying this expecting to see a fish, judge its size or read the structure of the bottom before dropping a rig, then you are buying something this hardware cannot do and never will.
What I did not test and therefore do not write about: the quality of the transducer itself, real sensitivity to small targets, behaviour in silt and in weed, and comparison with branded hardware on the same water. I describe only what I was able to establish: what this sonde sends and what the app does with it.
Sources and material to check for yourself
- NOAA – What is sonar? – how a fish finder works at heart: a transmitted pulse, echo return time, conversion into distance
- NOAA – how sound travels in water – about 1480-1500 m/s, the constant every conversion from echo time to depth rests on
- FAO Fisheries Technical Paper 240: Fisheries Acoustics – beam angle, target strength and the reason echo loudness says nothing about the length of a fish
- Bluetooth SIG – technology overview – the BLE transport the XJ02B uses to send its frame to the phone
Next episode: a sonde from the same protocol family that declares two frequencies, 125 and 330 kHz. I checked whether it really has them.
What hardware I test and on what legal basis
Every device described in this series was bought with my own money and is my property. I examine these units to know what actually reaches an angler’s hands and what I can demand from the hardware I design myself. The analysis covers one specific unit and the firmware version I found in it; other batches, versions and model variants may behave differently.
Observing, studying and testing how a program works in order to determine its underlying principles is permitted for a person who lawfully acquired the device: Article 75(2)(2) of the Polish Copyright Act, which implements Article 5(3) of Directive 2009/24/EC. The transmission capture involved only my own transmitter and my own receiver. I publish no source code, no memory dumps, no keys and no tools that would let anyone copy someone else’s software – only conclusions about what the hardware measures and what it does not.
Names and trademarks belong to their respective owners and are used solely to identify the hardware under review, as part of critical analysis and the right to inform. Photos taken from sales listings are used for the same purpose. If the manufacturer or the seller believes any conclusion is wrong, I will gladly repeat the measurements on a unit they provide and publish a correction.
That is how we work: before anything goes into our boats, it goes across this bench. And if it does not pass – we say so out loud, even when nobody wants to hear it.
 Asystent pomocy Extreme One