
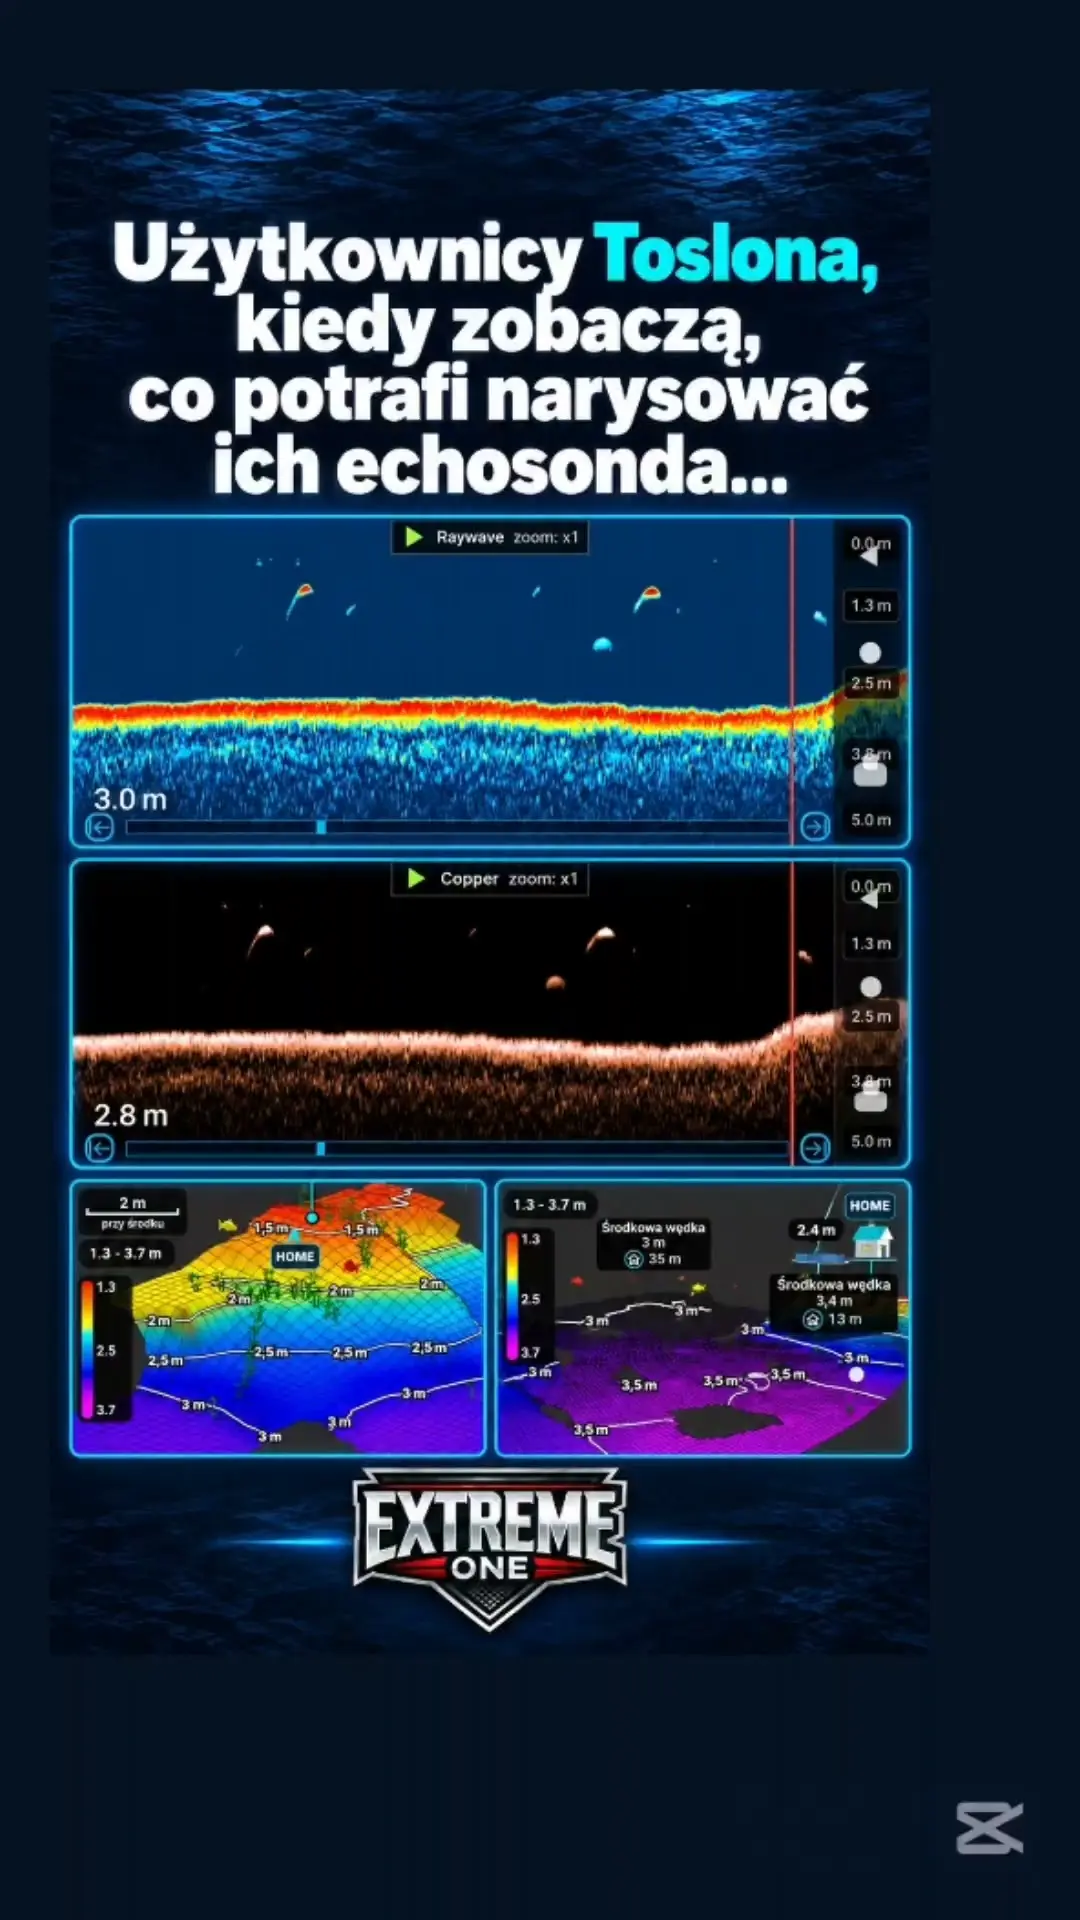
Toslon: see the echogram in new colours and 3D bathymetry
The Toslon echogram in Extreme One can be viewed in 37 ready-made palettes and in your own colours. A short presentation shows how to go from saved data to echo analysis and a fishery model on the RadioMaster AX12.
Real echoes, different ways of viewing them
The video presents readings from a Toslon TF520 v2. Choosing a theme helps you match the contrast and colours to what you want to look at. You can focus on the bottom profile, weaker returns in mid-water or a selected part of the history.
From echogram to fishery model
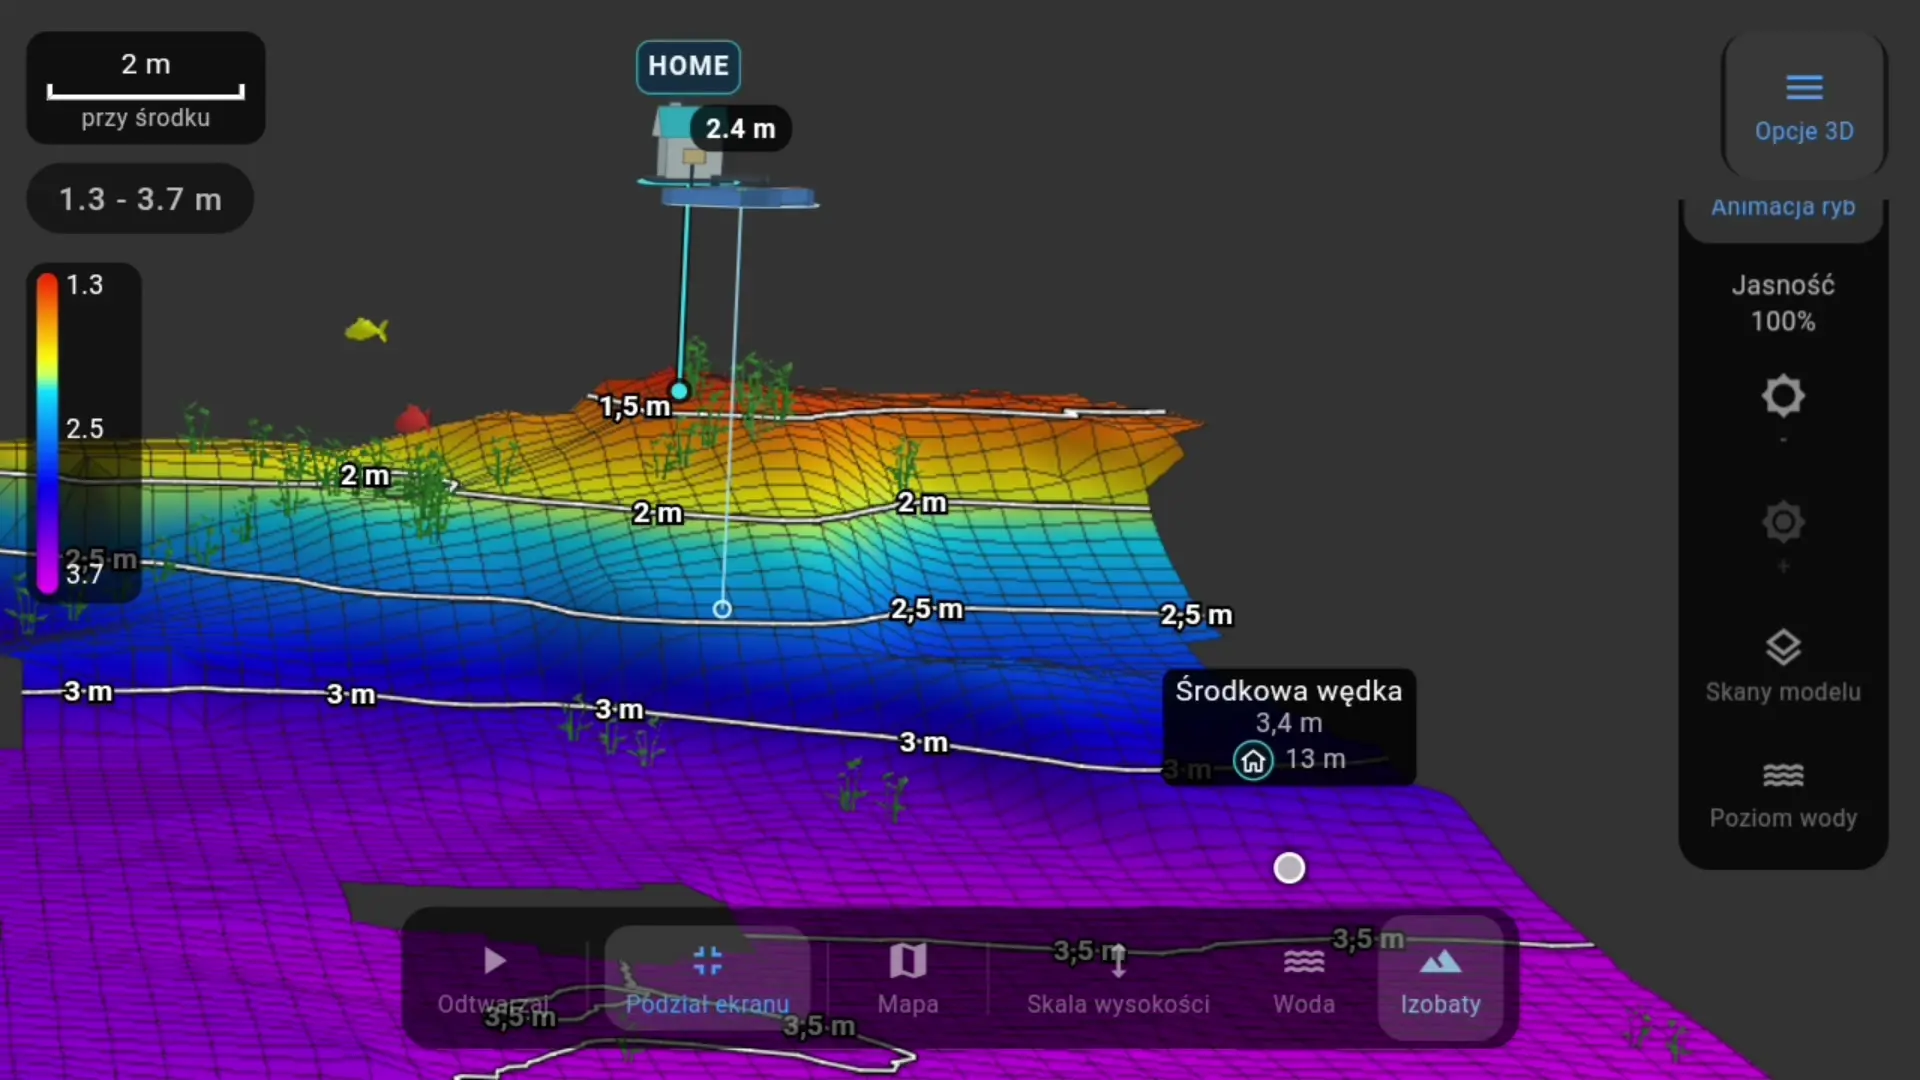
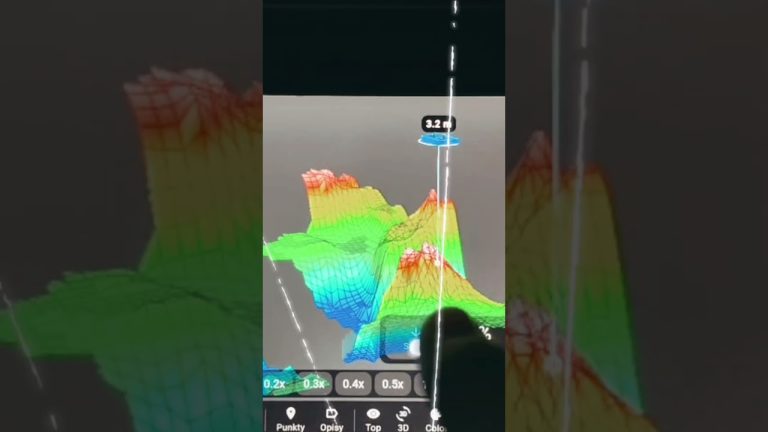
Bathymetry is created from the saved measurements and positions. In 3D view you rotate the model, look for shallows and drop-offs and compare different parts of the lake. The frame below comes from a real presentation of a TF520 v2 scan.
TF500, TF520 and TF640 in the AX12 presentation
The integration covers the Toslon TF500, TF520 and TF640 configurations being developed for the AX12. Details, a longer demo, echogram zoom and information on preparing the sonar can be found in the post Toslon on AX12: a new opening.
The same fish finder and new ways to analyse its data. Extreme One. Expect more.
Toslon is a registered trademark of its owner.
Toslon echogram: start by reading the scale
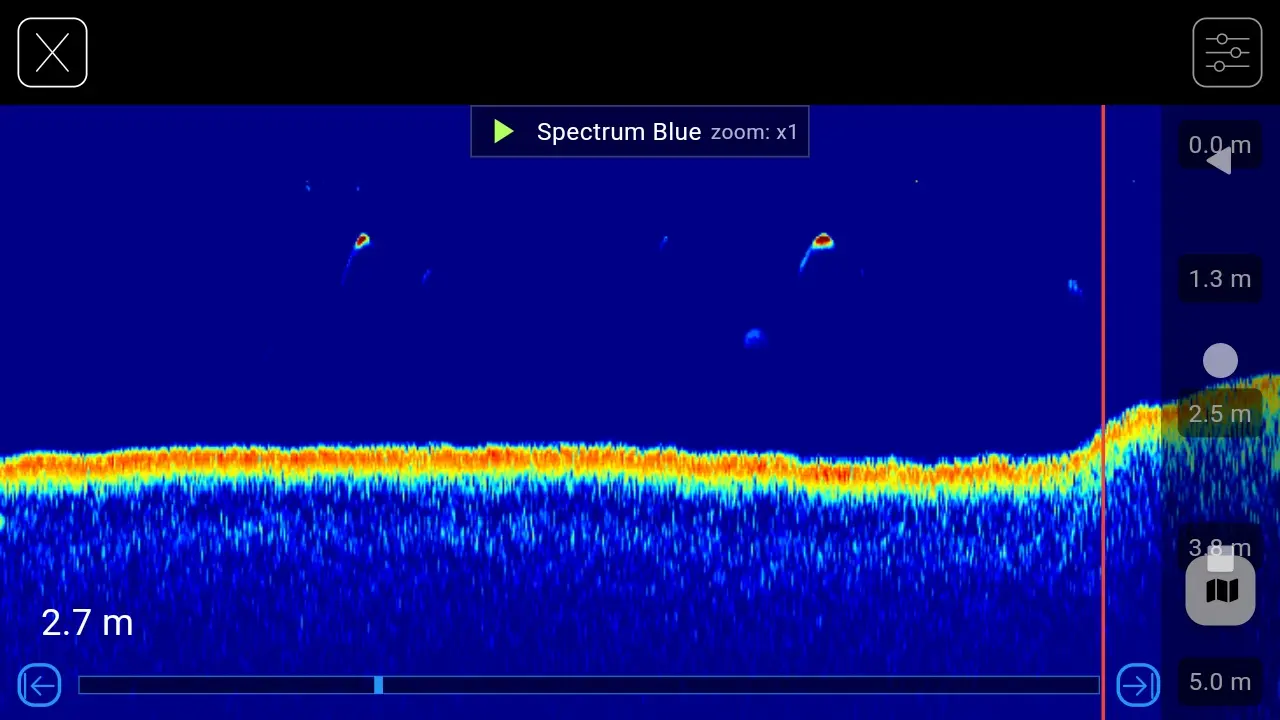
Before comparing colours, look at the vertical depth scale. It lets you place the visible returns relative to the surface and the bottom. Then find the part of the run you want to look at more closely. When you change the theme, stay on the same section of history. It is then easier to judge which colour combination shows the signal you are interested in most clearly.
The Toslon echogram shown in the video comes from real TF520 v2 readings. It is not a drawing of an example fishery. Successive columns correspond to saved measurements, and changing the palette gives the signal values different colours. You can adjust the image for your own comfort while keeping the option to return to the same section and compare it with several settings.
What to compare when changing palettes
Pay attention to how clearly the bottom is separated from the water column and whether weaker echoes remain visible next to stronger returns. A very bright colour may catch the eye, but brightness alone does not explain what caused the signal. It is worth following its course across neighbouring columns and relating it to the place the boat was passing over.
If you create your own palette, start with a theme you already read well. Change the colours gradually and check the effect on a familiar recording. In this way you can adjust the Toslon echogram to your preferred contrast without changing the selected run. Readability matters more than how many different shades draw attention on the screen at once.
3D bathymetry and measurement history
The map helps you understand how shallower and deeper parts relate to each other. The echogram shows the signal collected while passing over those places. It is worth using both methods of analysis: first find an interesting area on the model, then look at the measurements. This gives the shape of the terrain the context of the saved readings.
The Toslon echogram and the bottom model can be viewed many times after you have finished on the water. Rotate the map, check the legend and compare the chosen drop-off with the neighbouring plateau. When you save a swim, give it a name linked to your own observation. That way, on your next trip it will be easier to remember why that point needed checking again.
How to use the short demo
The video is an overview of how the image looks and how you move to the model. Individual themes appear only briefly, so for a careful comparison it is worth pausing on the frame you are interested in. The screenshots in this post let you look more calmly at the Spectrum Blue palette and the shape of the saved bottom. You will find a longer presentation of the integration in the related article.
Before preparing your own set, check its variant with the service centre. The fish finder model and connection method matter for reception on the transmitter. The Toslon echogram shown here is an example of a specific configuration with the TF520 v2. We list the other models in the integration description, and we keep the source of the scan shown unambiguous so that the image comparison is clear.
When discussing a scan with a friend, show the whole run first and only then the zoomed-in detail. Keeping this context makes it easier to explain where the return occurred and how it changed against the rest of the recording.
 Karpik Kroczek, asystent Extreme One